

Environmental & Energy Management System Suite
Energy Consumption Management
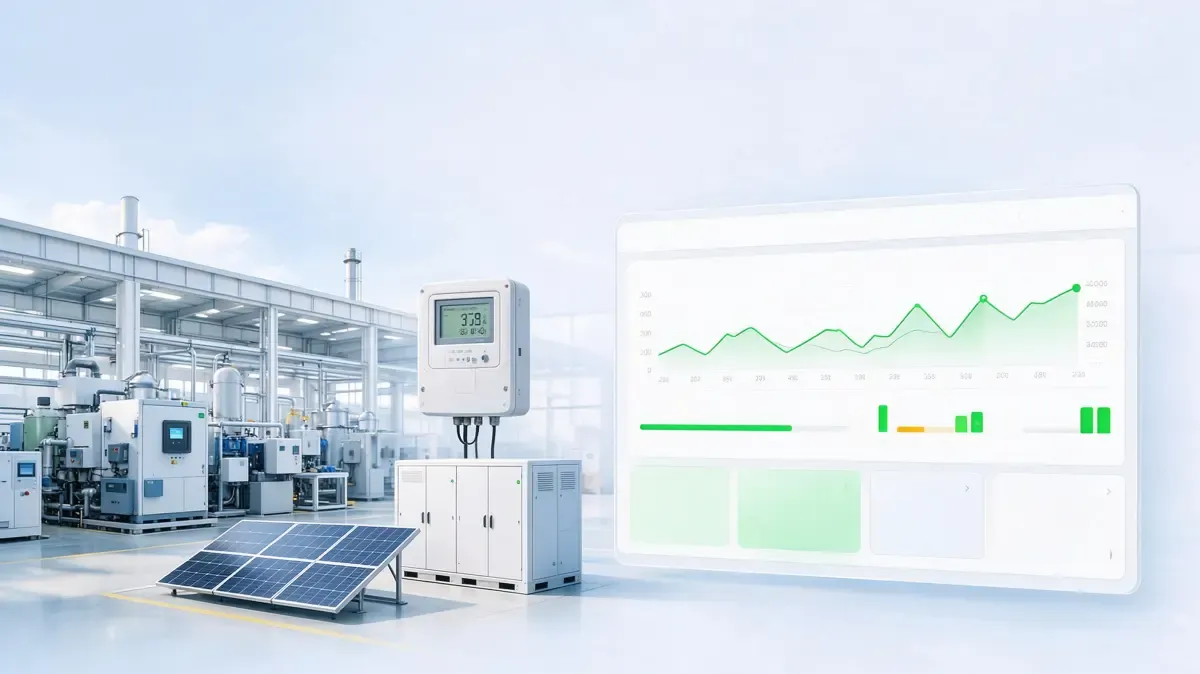
Energy usually arrives as one number: the monthly invoice, the total consumption, the total cost. Everything that would explain it — which line was running, which shift was on, which order was being made, how much was actually produced — sits somewhere else, in another system, or nowhere at all.
Energy Consumption Management starts from the meters you already have and works down to the unit. Electricity, water, gas and steam, compressed air, heating and cooling are collected from existing meters and gateways, then split by area, line, equipment, order or batch, and shift — so consumption can be read against output rather than against the calendar.
What comes out is three things a plant can act on: energy per unit, a baseline that moves with the work being done, and cost calculated against the tariff you are actually on — including the demand charges and the peak periods that decide what the month costs.
You cannot manage a number you cannot attribute.
What it is
One place for every medium. Electricity, water, gas and steam, compressed air, heating and cooling are collected together from the meters and gateways already installed.
A meter tree you define. Sites, buildings, areas, lines and equipment are modelled the way the plant is actually organised and the way it is actually billed.
Allocation by rule, not by guesswork. Where meters exist, consumption is measured. Where they do not, it is allocated on a basis you set — and reported as allocated, so nobody mistakes it for a reading.
Normalised against output. Consumption is put against production, so a busy week is not reported as a wasteful one. Energy per unit, per batch and per order all come from the same figures.
Cost on the tariff you are on. Consumption is converted to cost using the structure that applies: time-of-use periods, demand charges, power factor terms, and the different rates of different sites.
Warnings before the invoice. Demand climbing towards the contracted level, consumption outside the expected band, equipment running when the area is not producing, and large loads starting together to push the peak up.
What gets in the way today
One bill, nothing behind it. A total arrives, after the money has gone.
The invoice gives one figure for the month. And it arrives once the month has already been paid for.
Which line, which equipment and which shift used it is not recorded anywhere queryable. So the total cannot be explained after the fact.
Without that, saving energy means asking people to use less. And hoping the difference shows up somewhere later.
Where sub-meters exist, they are read by hand. And the reading ends up in a spreadsheet that is out of date before anyone looks at it.
No baseline, so nothing is abnormal. There is no level to be high against.
There is nothing to compare against. So no figure can be called high, and none can be called an improvement.
Comparisons between months are distorted by how much was produced. A busy month looks like a wasteful one, and a quiet one looks like a success.
Equipment idling, running overnight, or left on at weekends stays invisible. Until somebody happens to walk past it.
Nobody can say what a product should cost in energy. So the energy figure in a quotation is a guess.
The tariff is doing the damage. The unit price is only part of what the month costs.
Cost per unit of energy is one part of the bill. Demand charges and time-of-use periods decide the rest.
Production is scheduled without reference to tariff periods. Expensive hours get used as though they were cheap ones.
Large loads starting together set a peak. And that peak is what the month is charged on.
Contract terms such as power factor are discovered on the invoice. Which is to say, after they have been paid for.
Savings nobody can prove. The improvement is asserted, not evidenced.
Improvements are justified with estimates. And afterwards nobody can show what actually changed.
Without a baseline tied to output, less consumption looks the same as less work. Which is not a saving.
Nothing connects an energy project to the figures finance recognises. So the project stays a claim.
Each site reports on its own basis. Which makes comparison at group level impossible.
What it measures and how it splits it
Two questions decide whether the numbers are any use: what is being measured, and how it is divided between the things that used it.
What comes in | Where it is usually measured |
Electricity | Incomers, distribution boards, large drives, compressors, chillers, furnaces |
Water | Site inlet, process use, cooling towers, washing |
Gas and steam | Boilers, steam headers, ovens, dryers |
Compressed air | Compressor house, ring mains, main consumers |
Heating and cooling | Chilled and hot water loops, heat exchangers |
Consumption is then attributed. The dimensions below are the ones plants usually need, and they can be used together.
Split by | What it answers |
Area and building | Which part of the site is responsible |
Line or cell | What production actually costs in energy |
Equipment | Which units are the large consumers |
Order, batch or product | What a unit of output carries in energy |
Shift | Whether the same work costs the same at night |
Utility and shared services | How compressed air, steam and cooling are allocated to what uses them |
Metering is never complete, and the system does not pretend otherwise. Consumption that is measured is reported as measured; consumption allocated by a rule is reported as allocated; gaps, failed readings and obvious outliers are marked rather than smoothed over. The basis for allocating shared services is a decision the plant makes, not one the software makes for it — and because energy per unit depends on that basis, it has to be agreed before the figures go into a quotation or a cost model.
What you get
Where it is used
The same application, pointed at different plants. What changes is which media matter, how consumption is split, and which of the three outputs is worth the most.
Setting | What energy management focuses on |
Discrete manufacturing — automotive parts, machinery | Consumption at line and equipment level, comparison between shifts, compressors and machining centres |
Process and continuous production — chemicals, food and beverage | Steam, heating and cooling loads, energy per batch, cleaning and CIP |
Electronics and semiconductor | Cleanroom air handling, constant temperature and humidity, process cooling |
Central kitchens and cold chain | Refrigeration, cooking and hot water, overnight and weekend load |
Multi-site groups | One basis of comparison across plants, and a group view of cost and intensity |
High-consumption equipment | Compressors, injection moulding, melting and kilns, pumps and fans |
Capabilities
Grouped by what they do. Water appears here as one of the media that gets measured.
Capability | What it means |
Meter and gateway onboarding | Bring existing electricity, water, gas, steam and heat meters in over the protocols they already speak; add meters without rebuilding the structure. |
Data quality handling | Mark gaps, failed readings and outliers instead of filling them in silently, and keep measured values distinguishable from allocated ones. |
Meter tree | Model sites, buildings, areas, lines and equipment, and map every meter to where it sits. |
Allocation rules | Allocate shared and unmetered consumption on a basis you define, per site and per medium. |
Attribution to order, batch and shift | Attribute consumption to what was produced and to who was on shift. |
Energy per unit | Energy per unit, per batch and per order, against the output recorded in production systems. |
Baselines built against output | Expected consumption follows volume, product mix and conditions, so comparisons mean something. |
Variance alerts | Flag consumption outside the expected band, sudden changes, and slow drift that builds over time. |
Idle and out-of-hours detection | Equipment running while the area is not producing, overnight and at weekends. |
Power quality indicators | Power factor, load imbalance and other electrical indicators, where the installed meters provide them. |
Ranking of consumers | Order what uses the most, so effort goes where the energy is. |
Tariff modelling | Model time-of-use periods, demand charges and contract terms as they apply at each site. |
Demand monitoring and warnings | Track demand against the contracted level through the period, and warn while there is still time to act. |
Coincident starts | Show large loads starting together, which is what sets the peak. |
Scheduling against tariff periods | Show what each period costs, so work that can be moved is planned into the cheaper hours. |
Demand control strategies | Where the site has controllable loads and has authorised it, load shedding and staggered start strategies can be configured. Which loads may be interrupted, in what order, and what must never be interrupted are decided by the plant, not by the software. Production and safety take precedence over any strategy. |
What-if on schedules | Estimate what a change of schedule or start-up sequence would do to the peak before committing to it. |
Targets and tracking | Set targets by area, line or site and track them against the baseline. |
Actions and verification | Raise improvement actions, then measure the same point afterwards — before and after, against the same baseline — to see whether it changed. |
Internal benchmarking | Compare lines, shifts, equipment and sites on the same basis. |
Intensity trends | Track energy per unit over time — the figure that survives changes in volume. |
Production systems | Take output, orders and shift data from MES or ERP, which is what makes energy per unit possible. |
Finance and cost systems | Hand energy cost to the systems that hold cost and budget, in the structure the invoice uses. |
Building and utility systems | Take meter data from the building, utility and power monitoring systems already installed. |
Data for carbon reporting | Energy data can be provided as an input to carbon accounting and disclosure processes. This application measures and manages energy; it does not perform carbon accounting. |
Deployment choice | Run in the cloud, on your own servers, or close to the plant — usually decided by where operational data may be processed and stored. |
Access and retention | Role-based access per site and area, retention set by policy, with access and changes logged. |
How it works
Connect. Existing meters and gateways are brought in. Where metering is missing, the gap is recorded rather than filled in.
Model. Sites, areas, lines and equipment are arranged into a meter tree that matches how the plant runs and how it is billed.
Allocate. Rules are set for shared services and unmetered consumption, and agreed by the people who will be held to the figures.
Baseline. Expected consumption is built against output, product mix and conditions. Everything after this depends on it.
Watch. Variance, idle running, out-of-hours consumption, demand approaching the limit and coincident starts are flagged as they happen.
Act and verify. Improvement actions are raised, schedules and start-up sequences are adjusted where that is authorised, and the same point is measured afterwards to show what changed.
Deployment, integration and data boundaries
Where it runs. In the cloud, on your own servers, or close to the plant. Sites that may not send operational data off site usually decide this.
What it connects to. Production systems for output, orders and shifts; finance for cost and budget; building, utility and power monitoring systems for meter data.
What it starts from. Meters, sub-meters and gateways already installed. Whether to add more metering is a decision the plant makes on the strength of what the data shows.
Control and authority. Where load control is configured, which loads may be interrupted and in what order is decided by the plant. Without that decision the system does not act on production, and production and safety take precedence.
What is local. Tariff structures, metering regulations, reporting duties, retention and access depend on the jurisdiction and the site. Configuration is set to fit them; the system does not make those decisions.